
This guide provides a comprehensive overview of the Spillard Dashboards, highlighting key features such as human detection trends, vehicle monitoring, and journey analytics. By exploring these functionalities, users can enhance their understanding of safety metrics, driver behavior, and vehicle performance. It serves as a valuable resource for anyone looking to optimize fleet management and improve operational efficiency. Viewing this guide will empower users to leverage data effectively for better decision-making.
Spillard Live Dashboards Overview
This guide provides a comprehensive overview of the Spillard Dashboards, highlighting key features such as human detection trends, vehicle monitoring, and journey analytics. By exploring these functionalities, users can enhance their understanding of safety metrics, driver behavior, and vehicle performance. It serves as a valuable resource for anyone looking to optimize fleet management and improve operational efficiency. Viewing this guide will empower users to leverage data effectively for better decision-making.
1. Navigate to https://beta.spillard.live/
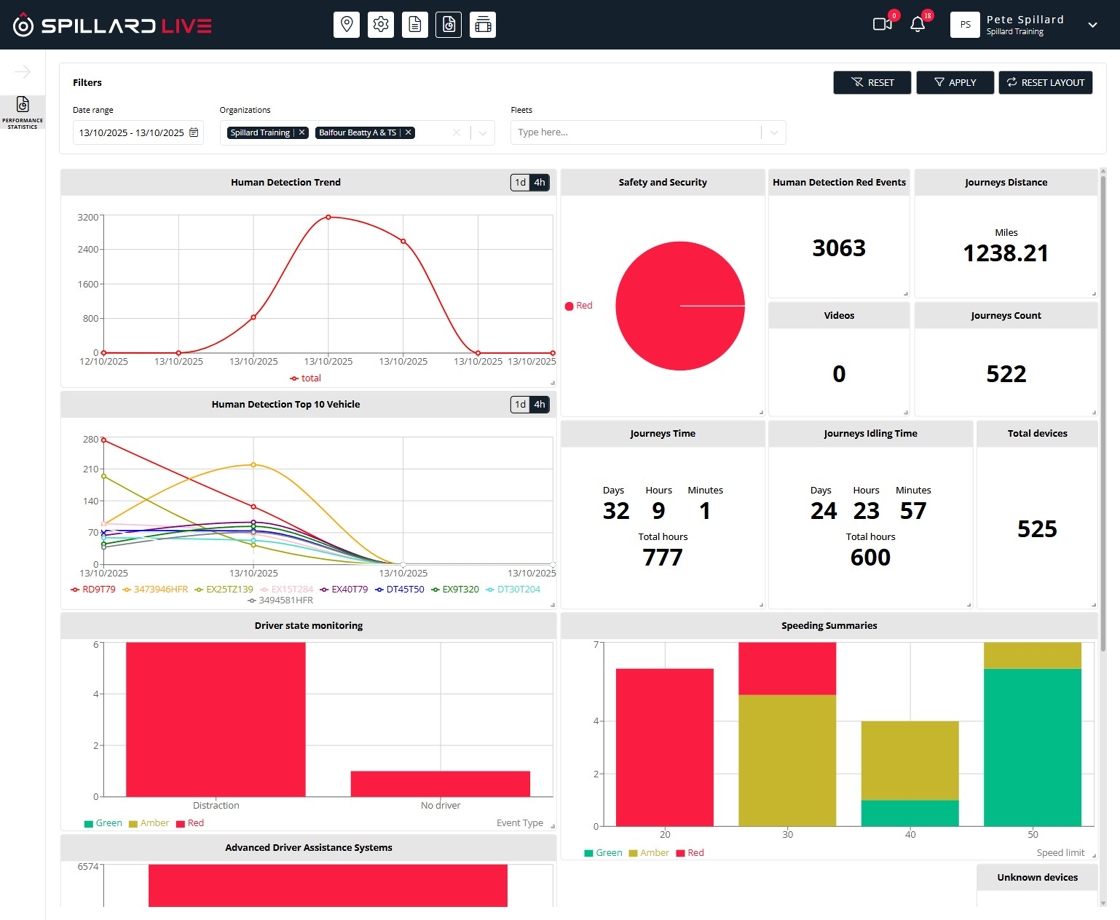
2. “Human Detection Trend” 1day or 4hours

3. “Human Detection Top 10 Vehicle”
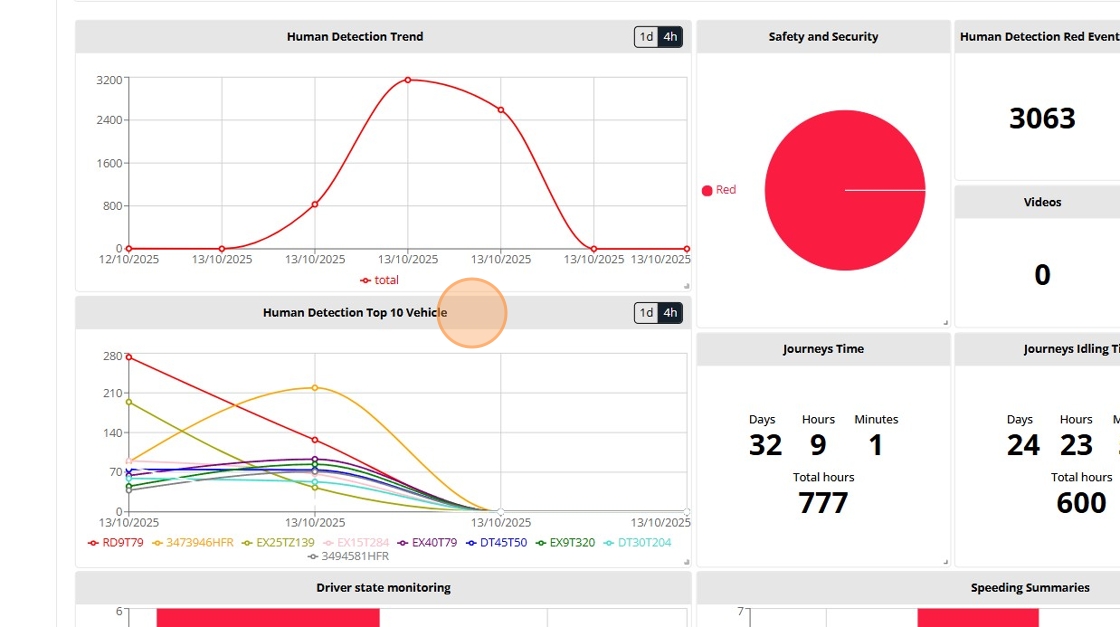
4. Panic Alert Button Presses

5. “Human Detection Red Events”

6. “Videos” requested by users

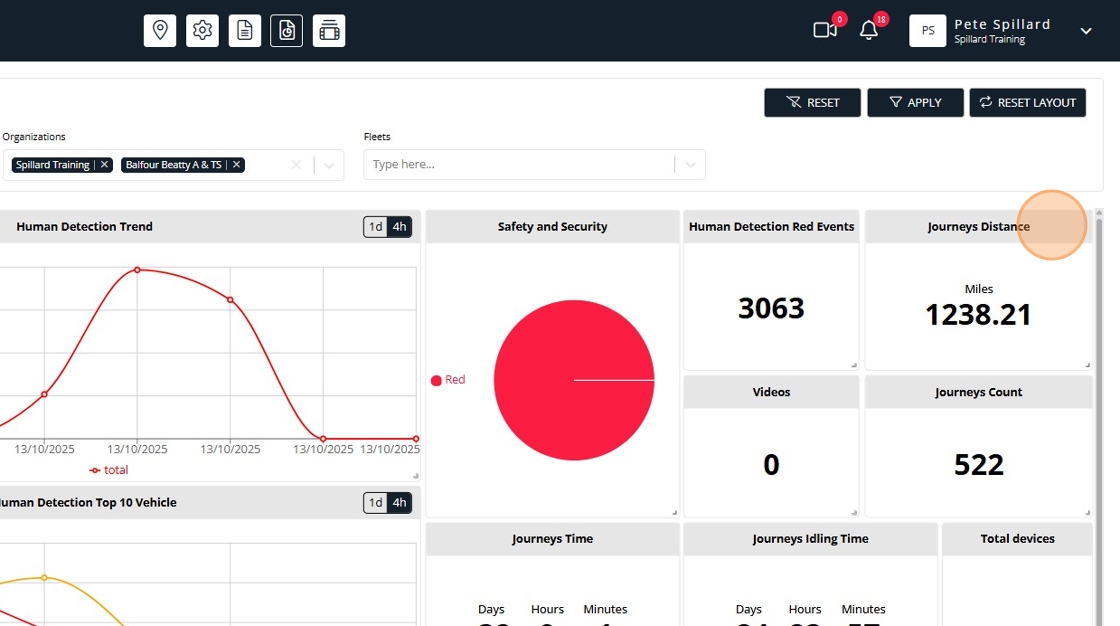
7. “Journeys Distance” Miles covered by vehicles
8. “Journeys Count”
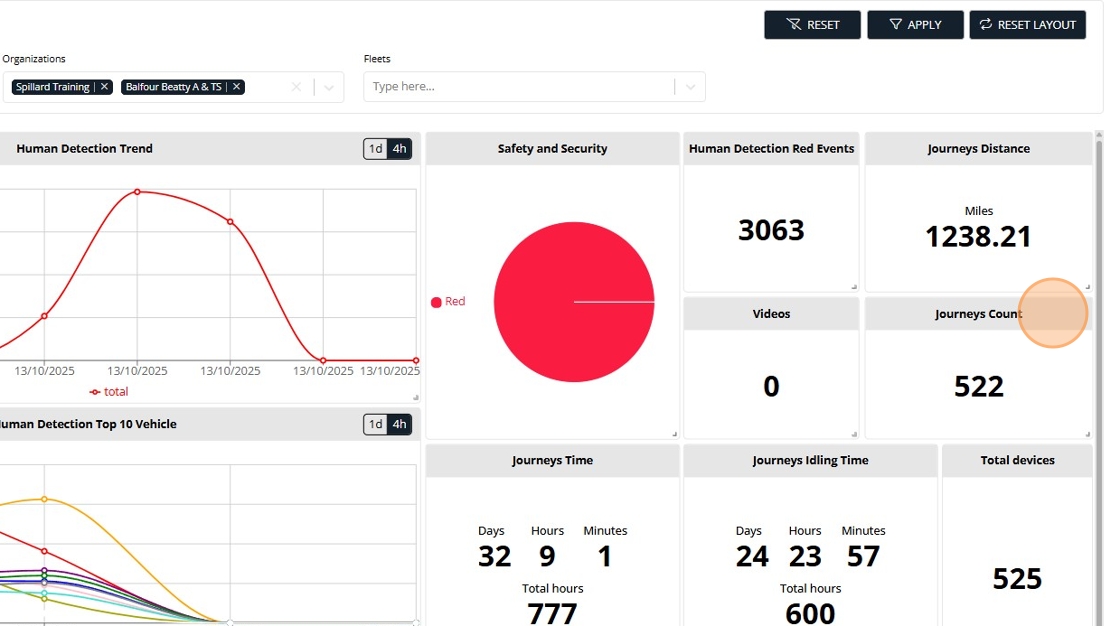
9. “Journeys Time”

10. “Driver status monitoring”
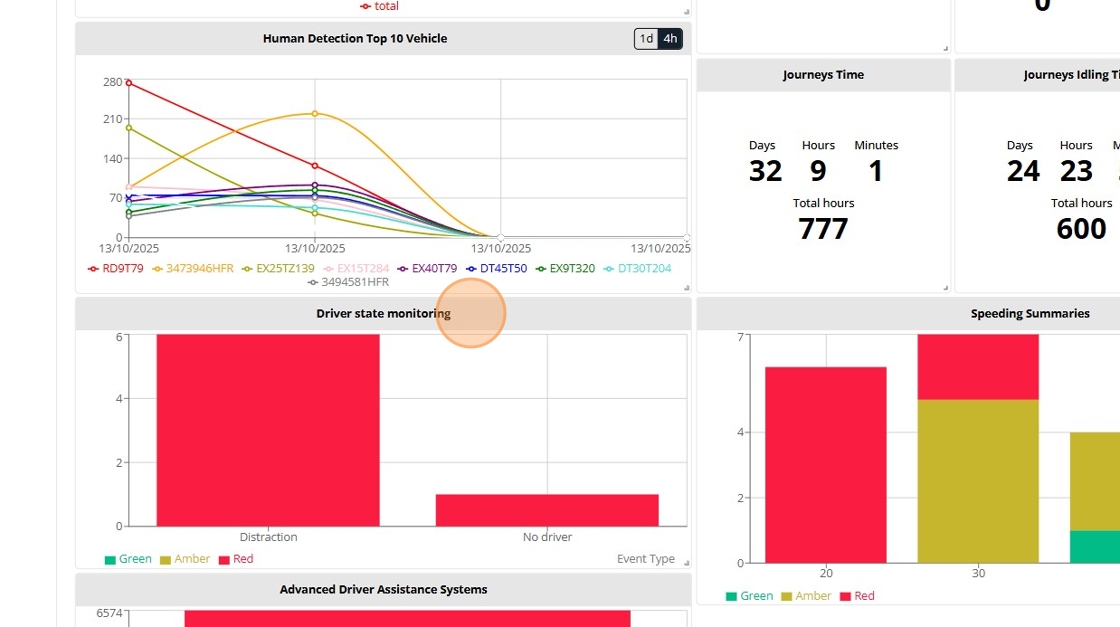
11. “Speeding Summaries”
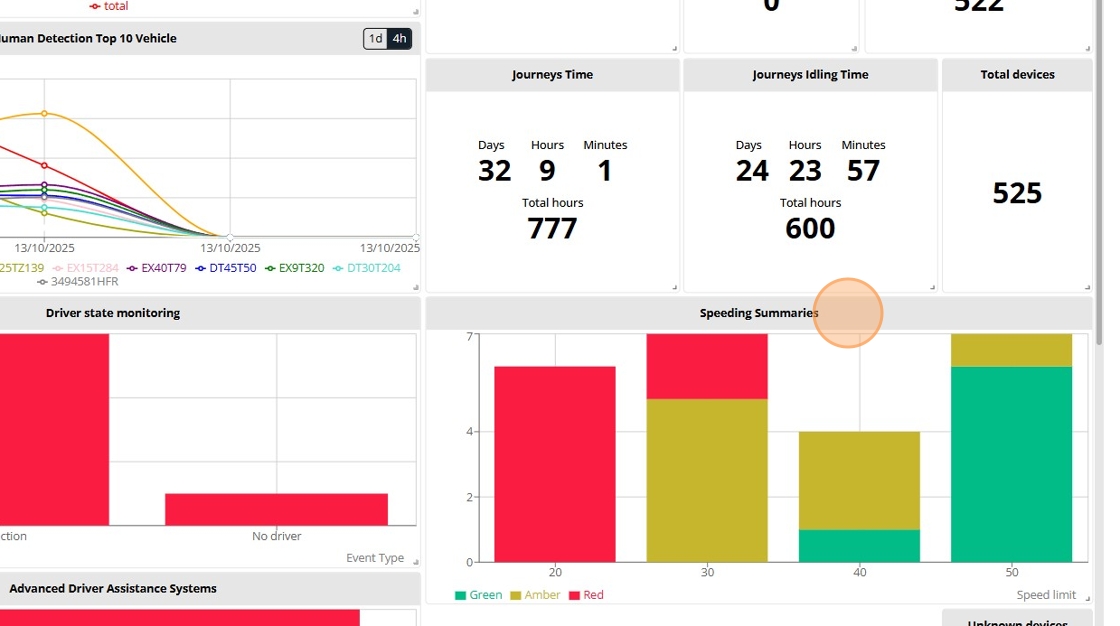
12. “Advanced Driver Assistance Systems”
